| Home|CRC Analysis|Tutorial|Documentation| FAQs| References |
Step by Step Tutorial of CRCView Web Server
For a PDF version of this tutorial, click here.
CRCView is a web based tool designed for clustering microarray gene expression data. Clustering is performed on genes based on their expression profiles across multiple experiments. A detailed step-by-step walk through is provided as follows.
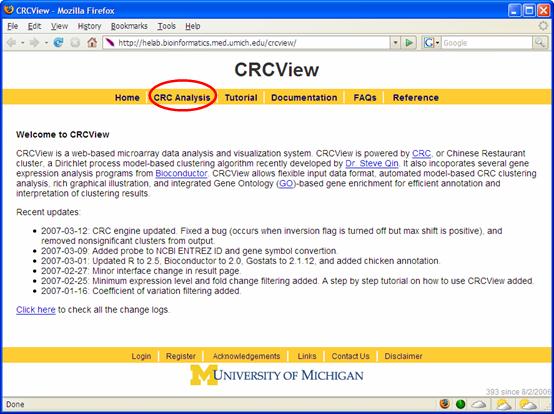
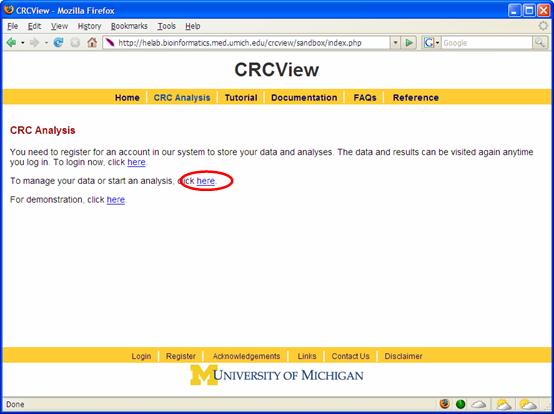
1. Get started. Point your browser to http://crcview.hegroup.org/. To start, click on "CRC analysis" in the yellow bar at the top as highlighted in Figure 1. At the next page, click "here" at the second line as highlighted in Figure 2. This will take you to the login page.
Figure 1.
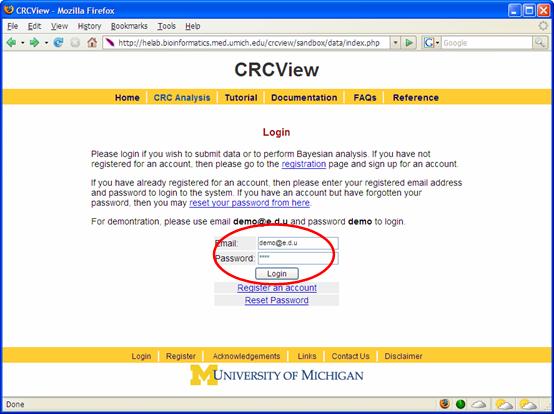
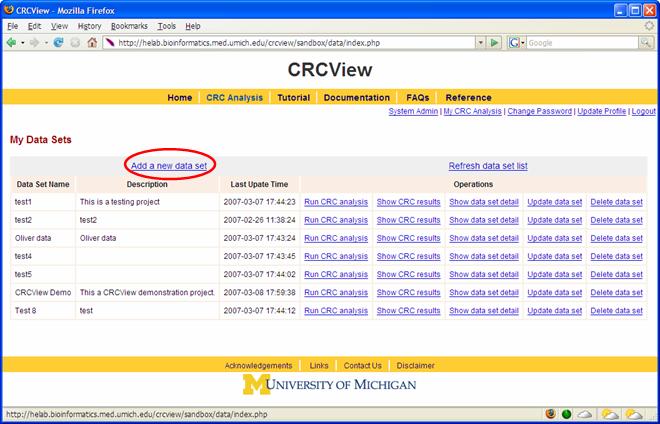
Figure 2. 2. Set up an account. Follow the instruction to set up an account at the CRCView website and login as shown in Figure 3. This will take you to you own private account in CRCView system, where all your uploaded data and analysis results will be securely stored. As shown in Figure 4, all historical records are automatically saved in CRCView web server such that you can easily find out previous analyses you have conducted. The account is secure and the content is encrypted, no one other than the owner of the account is able to see the contents.
Figure 3.
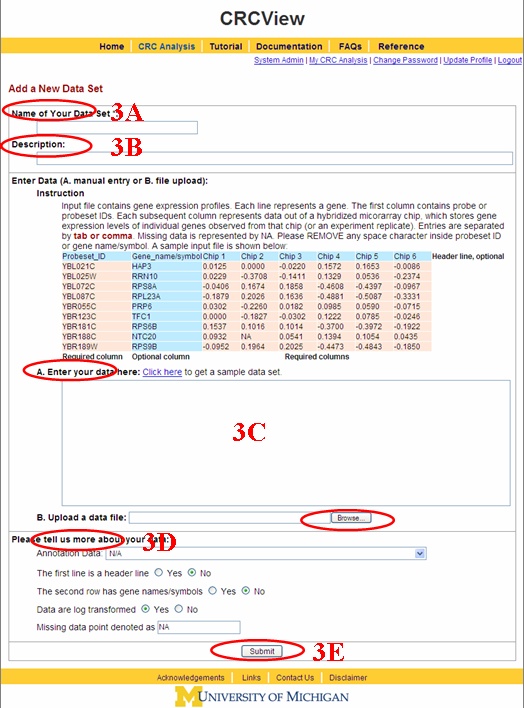
3. Add a new dataset. To analyze a new dataset, click on "add a new dataset" as high lighted in Figure 4. The linked page is illustrated in Figure 5. 3A. First, enter a name for the new dataset, required as indicated by "*". 3B. A description of the dataset can be entered here. Useful information such as source of the data, experimental conditions are examples of entrees here. 3C. A sample
dataset is provided next. Columns in pink (gene IDs (for example, Affy IDs) and
expression profiles) are required, rows and columns in blue (column names in
the first row and gene names (or secondary identifier) in second column) are
optional. There are two ways of entering data, either by direct copy and paste
or uploading a plain text file. 3D. CRCView allows flexible input formats which eliminates annoying reformatting when performing CRC clustering analysis. Here the user is able to specify the key characteristics of her data, and CRCView will automatically adjust the input data format internally. The first two questions relate to whether the optional row and/or column are present. The third question regards whether the data have been log transformed. CRC is performed on log transformed expression levels. An extra log transformation step will be performed if the data entered is not yet log transformed. The last question is the symbol for missing data. The default is "NA", but other symbols entered here can be used instead, for example, common symbols are "-999", "?", "-", etc. User can specify a corresponding microarray annotation data which will be used in the later analysis (probe to gene mapping and GOStats analysis). 3E. After data is entered, and format options are specified, click submit button, the data will be uploaded to the CRCView database, and the user will be taken to the CRC analysis setting page.
Figure 4.
Figure 5.
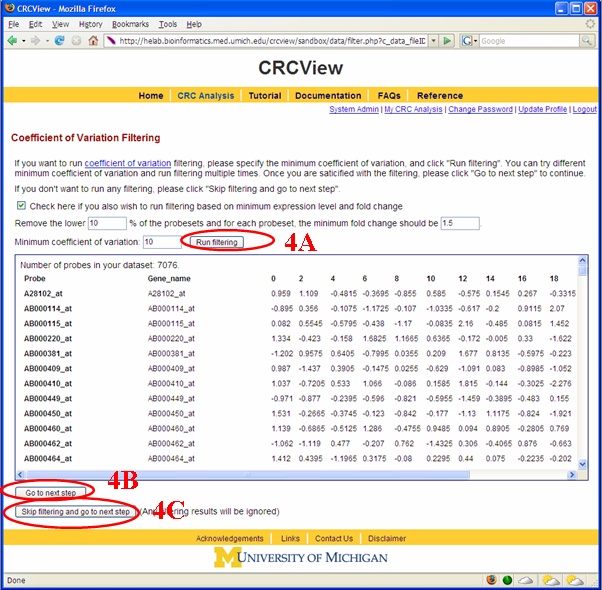
After a new dataset is uploaded, the users can initiate CRC analysis by clicking “Run CRC analysis”. A filtering page will show up as illustrated in Figure 6. A user can run filtering based on minimum Coefficient of Variation (CV), or run filtering based on minimum CV, minimum value and minimum fold change. 4A. Click “Run filtering” if you wish to run filtering. 4B. Click “Go to next step” if you are satisfied with the filtering results. 4C. Click “Skip filtering and go to next step” if you wish to don’t want to run filtering. All the filtering results will be ignored.
Figure 6.
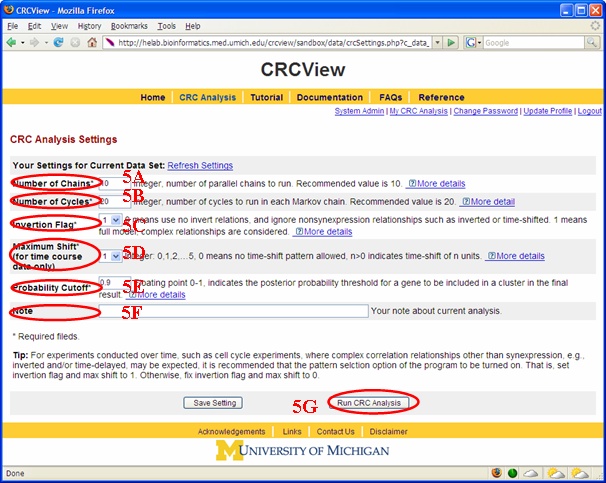
After a new dataset is uploaded, the users will be taken to the CRC analysis setting page as illustrated in Figure 7. A few parameters need to be specified here. 5A. Number of chains. CRC uses MCMC to infer unknown cluster memberships for all genes. Typically, multiple independent Markov chains with different initial states are used in this MCMC schemes. The main benefit of using multiple independent Markov chains is to ensure more thorough exploration of the entire sample space to avoid trapping at local mode. More chains potentially give better result but will take more computing time (linear increase). A good strategy is to start with low number to get quick preliminary results for evaluation, and then use a relatively large number to get the best result possible. The decision should also be made according to computing time. Recommended value is 10, the upper limit allowed is 100. 5B. Number of cycles or number of iterations. Within each Markov chain, CRC repeatedly goes through every gene and reassigns each gene's membership. The total number of assignments = number of cycles × total number of genes. More cycles means the Markov chain is more likely to be converged but will be more time consuming. The Bottom line is to ensure the markov chain has converged long before the chain ends. It is recommended that one starts with low number of cycles to get preliminary results, and then increase it later, say, 100, for final result. If one believes the MCMC procedure converges fast (can be seen from the log likelihood trace plot), lower number of cycles is fine. Selection of this number depends on computation time. The upper limit is 1000. 5C. Inversion flag. This parameter tells CRC whether to look for inverted correlation pattern when clustering. This maybe of interest when dealing with time course experiments or experiments where genes maybe antagonistically regulated. Default value for this parameter is 0 which indicates no inversion pattern, alternatively, user can change this to 1 if she believes some inversion correlation patterns are expected. 5D. Maximum Shift. This parameter tells CRC whether to look for time-delayed correlation pattern when clustering. This maybe of interest when dealing with time course experiments where genes may display correlation with a time-shift. Default value for this parameter is 0 which indicates no time-shift pattern is allowed, alternatively, user can change this to a positive integer if she believes time-shifted correlation patterns are expected. Only low number such as 1 or 2 is recommended unless time between neighboring time-course experiments are very short. The Upper limit is 5. 5E. Probability cut-off. This parameter tells CRC to filter genes shown in a result cluster. Only genes with posterior probability of belonging to this cluster greater than this cut-off value will be retained in the result cluster report. The reason of this filtering step is that high posterior assignment probability indicates better fit of the expression profile with its cluster and is more likely to be biological meaningful. Ability to calculate this probability is an important advantage of model-based clustering methods. Users can use this information to prioritize their clustering results. Default value for this parameter is 0 which indicates no filtering (all genes in a cluster are reported). Users can increase this value such that only genes shown tight correlation pattern within a cluster will be reported. 5F. Note. Users can write down comments on their analysis here such as "preliminary". "final", etc. Information in this box is optional. 5G. After entering all information in 5A-F, click here to initiate the CRC run.
Figure 7.
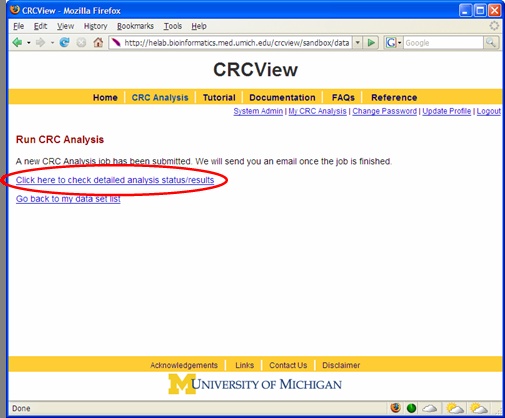
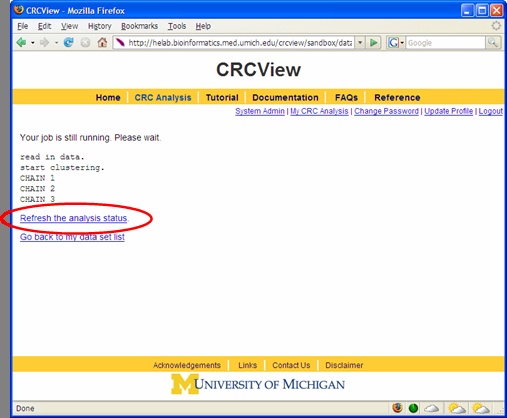
After CRC run was initiated, a new page will appear as shown in Figure 8 acknowledging that the CRC job has been submitted. During CRC run, one may click the place highlighted to monitor the progress of the job. A sample progress report page is illustrated in Figure 9. It shows how many chains have been completed. This page can be refreshed to get the updated progress by click the highlighted place. When the job is finished, an automatic email will be sent to you to inform you the analysis is completed, you may click the link provided in the email to directly access the result page.
Figure 8.
Figure 9.
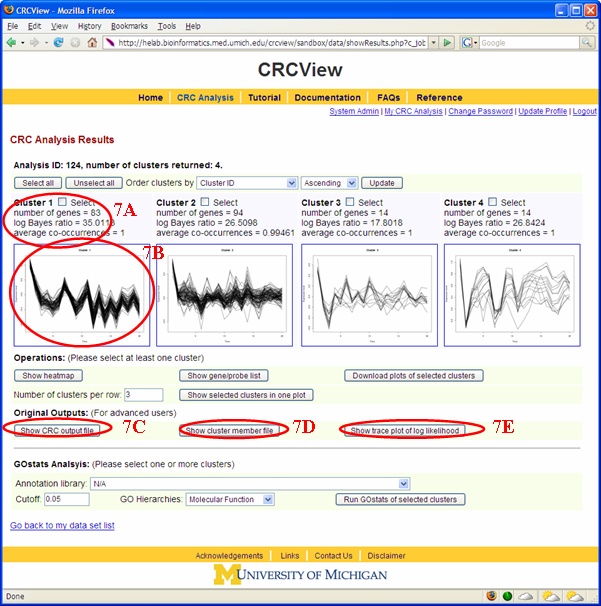
In CRCView, rich information is provided on the clustering results. All results can be accessed from the result summary page shown in Figure 10. 7A. For each
cluster generated by CRCView, basic statistics are provided here which include
number of clusters and two types of cluster quality measurements: Log Bayes
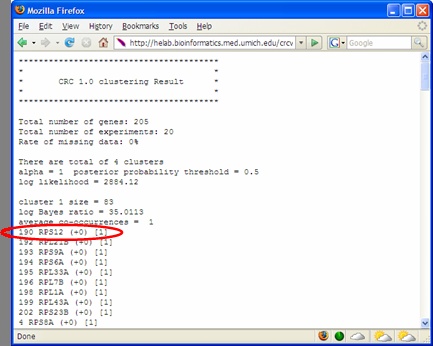
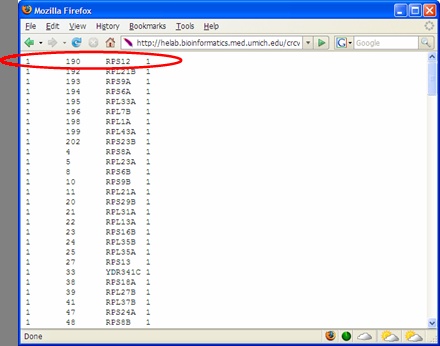
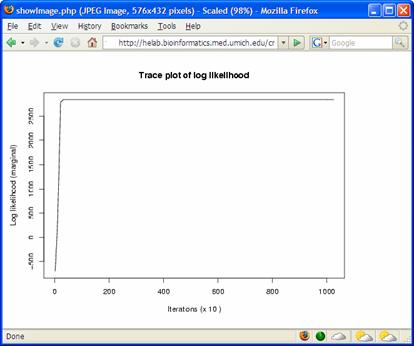
ratio and average co-occurrence. Log Bayes ratio is defined as: 7B. For each cluster generated by CRCView, a thumbnail trace plot of the expression profiles is shown here to allow users to quickly assess the basic characteristics of the cluster, such that more detailed display or re-analysis can be planned afterwards. 7C. CRCView also provides the traditional summary file that listed all member genes in a cluster along with the posterior probabilities of their assignment. This is the main result file generated by CRC, and can be obtained by clicking the highlighted area next to output file. A sample output file can be found in Figure 11. As one can see, for each member gene in a cluster identified by its gene ID, a number in parenthesis indicates the correlation pattern. "+0" means positive correlation with no time-shift, "-1" means inverted correlation with one time point shift when its expression profile is compared with that of the cluster. The value inside the square bracket indicates the posterior assignment probabilities. The higher the probability, it is believed that more likely this gene belong to this cluster. 7D. A cluster member file can be obtained by clicking the link here. A sample cluster member file is shown in Figure 12. This is a tab-delimitated plain text file. Each line represents a gene. The first number indicates the cluster ID, followed by the order of the member gene in the original dataset, gene ID and a number indicates its correlation relationships with the cluster expression pattern. This number ranges from 1 to 4, indicating positive correlation with no time-shift (1), negative correlation with no time-shift (2), positive correlation with time-shift (3) and negative correlation with time-shift (4). This file maybe useful for getting summary statistics or additional graphical outputs using software such as R. 7E. A trace plot of the log likelihoods during the CRC iterations can be obtained from the link shown here. This is to monitor the convergence of the Markov chains. A fast increasing, then stabilized pattern as shown in Figure 13 is what to be expected. Different Markov chain is illustrated with lines with different color. Multiple lines converge to approximately the same value is an indicator of likely convergence.
Figure 10.
Figure 11.
Figure 12.
Figure 13.
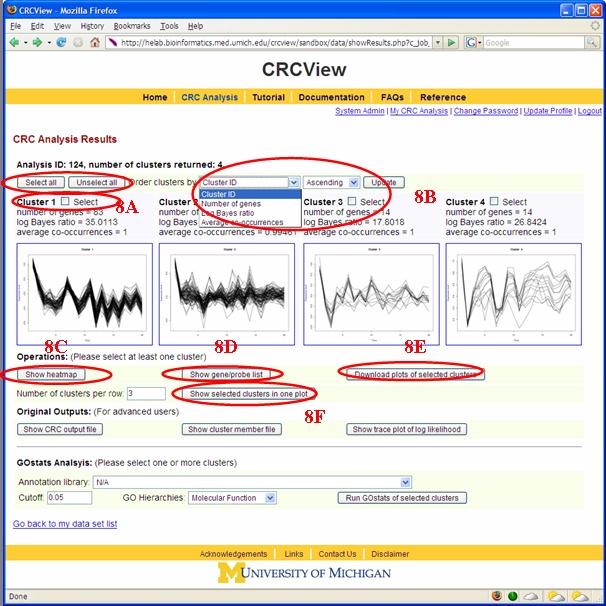
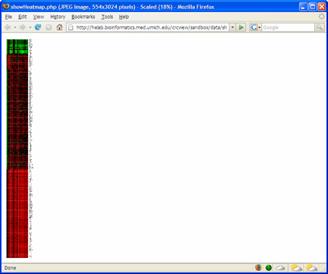
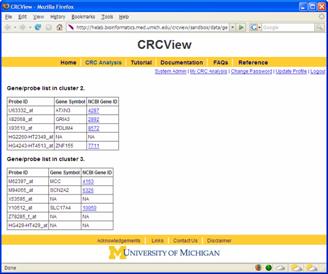
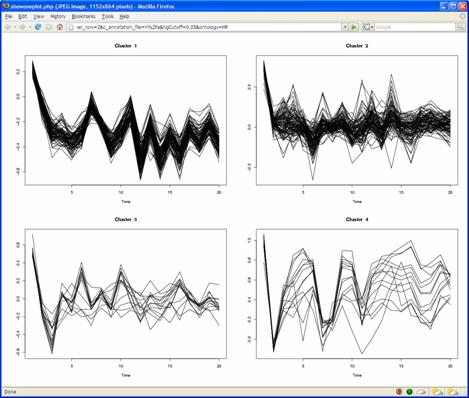
In CRCView, the user have many options to customize the display of clusters they are interested. These options are highlighted in Figure 14. 8A. Selecting clusters for more display or analysis options. One may want to concentrate on only a subset of clusters for further analysis. CRCView allows users to display or perform analysis on any subset of clusters. To select, one can either click "select all" to include all clusters, or click on the "select" box above each cluster's thumbnail trace plot. 8B. CRCView also allows users to rearrange the order of displayed clusters according to several criteria. This can be done by select criteria available at the order cluster by pull down menu at the top. The four available criteria to choose from are "Cluster ID", "Number of genes", "Log Bayes ratio" and "Average co-occurrence". The cluster ID is the original order. The users can choose to display them in ascending or descending orders according to these criteria. 8C. After clusters of interest have been chosen; the user can click the "download selected cluster images as one zip file" to export all graphical outputs for publication or further analysis. 8D. CRCView provides heatmap (aka Eisen plot) for selected clusters. This can be achieved simply by clicking the "show heatmap of selected cluster" button. A sample heatmap is shown in Figure 15. 8E. To get a list of genes in each cluster, click the "show gene list of selected cluster" button. A sample gene list is shown in Figure 16. It is a plain text file, each line contains a gene name, different clusters are separated by an empty line. 8F. CRCView allows user to generate trace plots of selected clusters. This can be achieved by click the "show selected cluster in one plot" button. The users can even arrange the format of the plot by specifying number of cluster per row in the nearby pull down menu. A sample plot is shown in Figure 17.
Figure 14.
Figure 15.
Figure 16.
Figure 17.
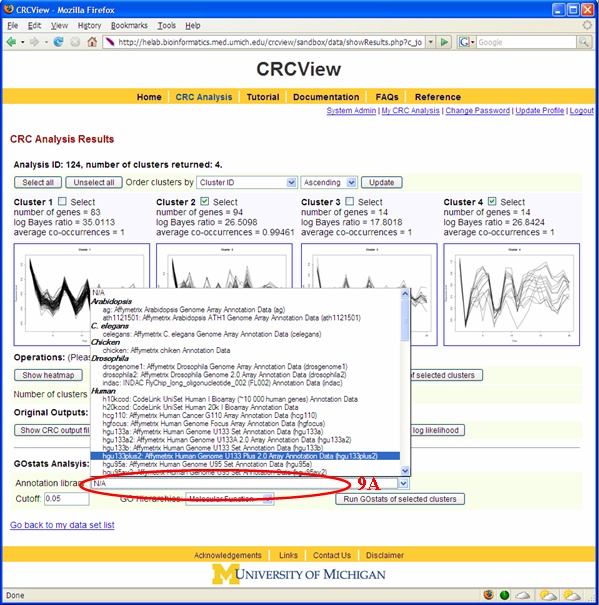
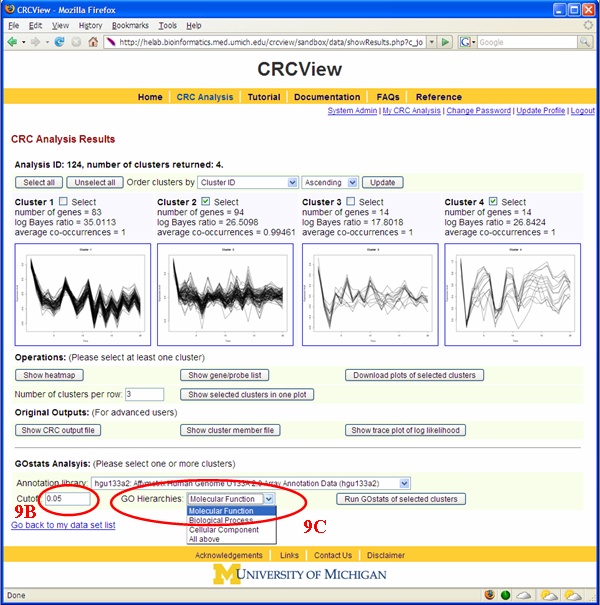
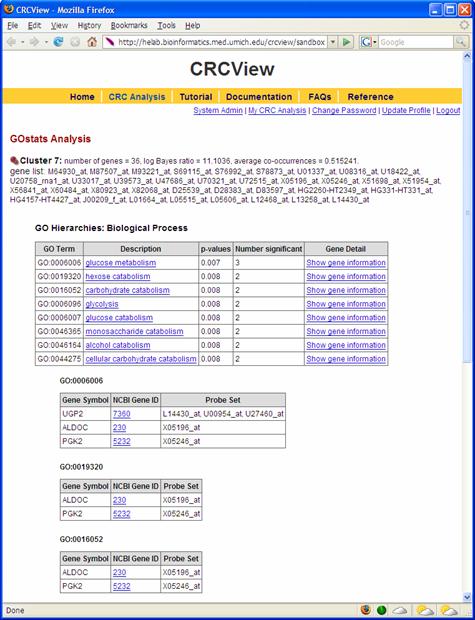
An important step in clustering analysis is validating/interpreting the clustering results. CRCView provides automatic GO Term enrichment analysis for each cluster the user selected. Figures 17 and 18 illustrated how such type of analysis can be performed. 9A. The first step in GO term enrichment analysis is to select an appropriate annotation data file. This can be done from choosing among the available files in the "Annotation Data" pull down menu. These files are collected from Bioconductor package. Currently there are 75 available, including Human, mouse, rat. 9B. Cut-off value: this is the significance level for the hypergeometric test. 9C. Users can choose from the three GO categories: Molecular function, Biological process and Cellular Compartment. A sample GO term enrichment analysis result is shown in Figure 20.
Figure 18.
Figure 19.
Figure 20.
Reference Qin ZS. (2006) Clustering microarray gene expression data using weighted Chinese restaurant process. Bioinformatics 22(16):1988-1997.
Contact The CRC system has been created and maintained at the University of Michigan. Please contact us if you have any questions or comments:
Zuoshuang Xiang, Unit for Laboratory Animal Medicine,
Dr. Steve Qin, Department of Biostatistics,
Dr. Yongqun He, Unit for Laboratory Animal Medicine, Department of Microbiology and Immunology, Bioinformatics Program,
|
| Login|Register| Acknowledgements| Links|Contact Us|Disclaimer |